
← All Insights

2023 in numbers

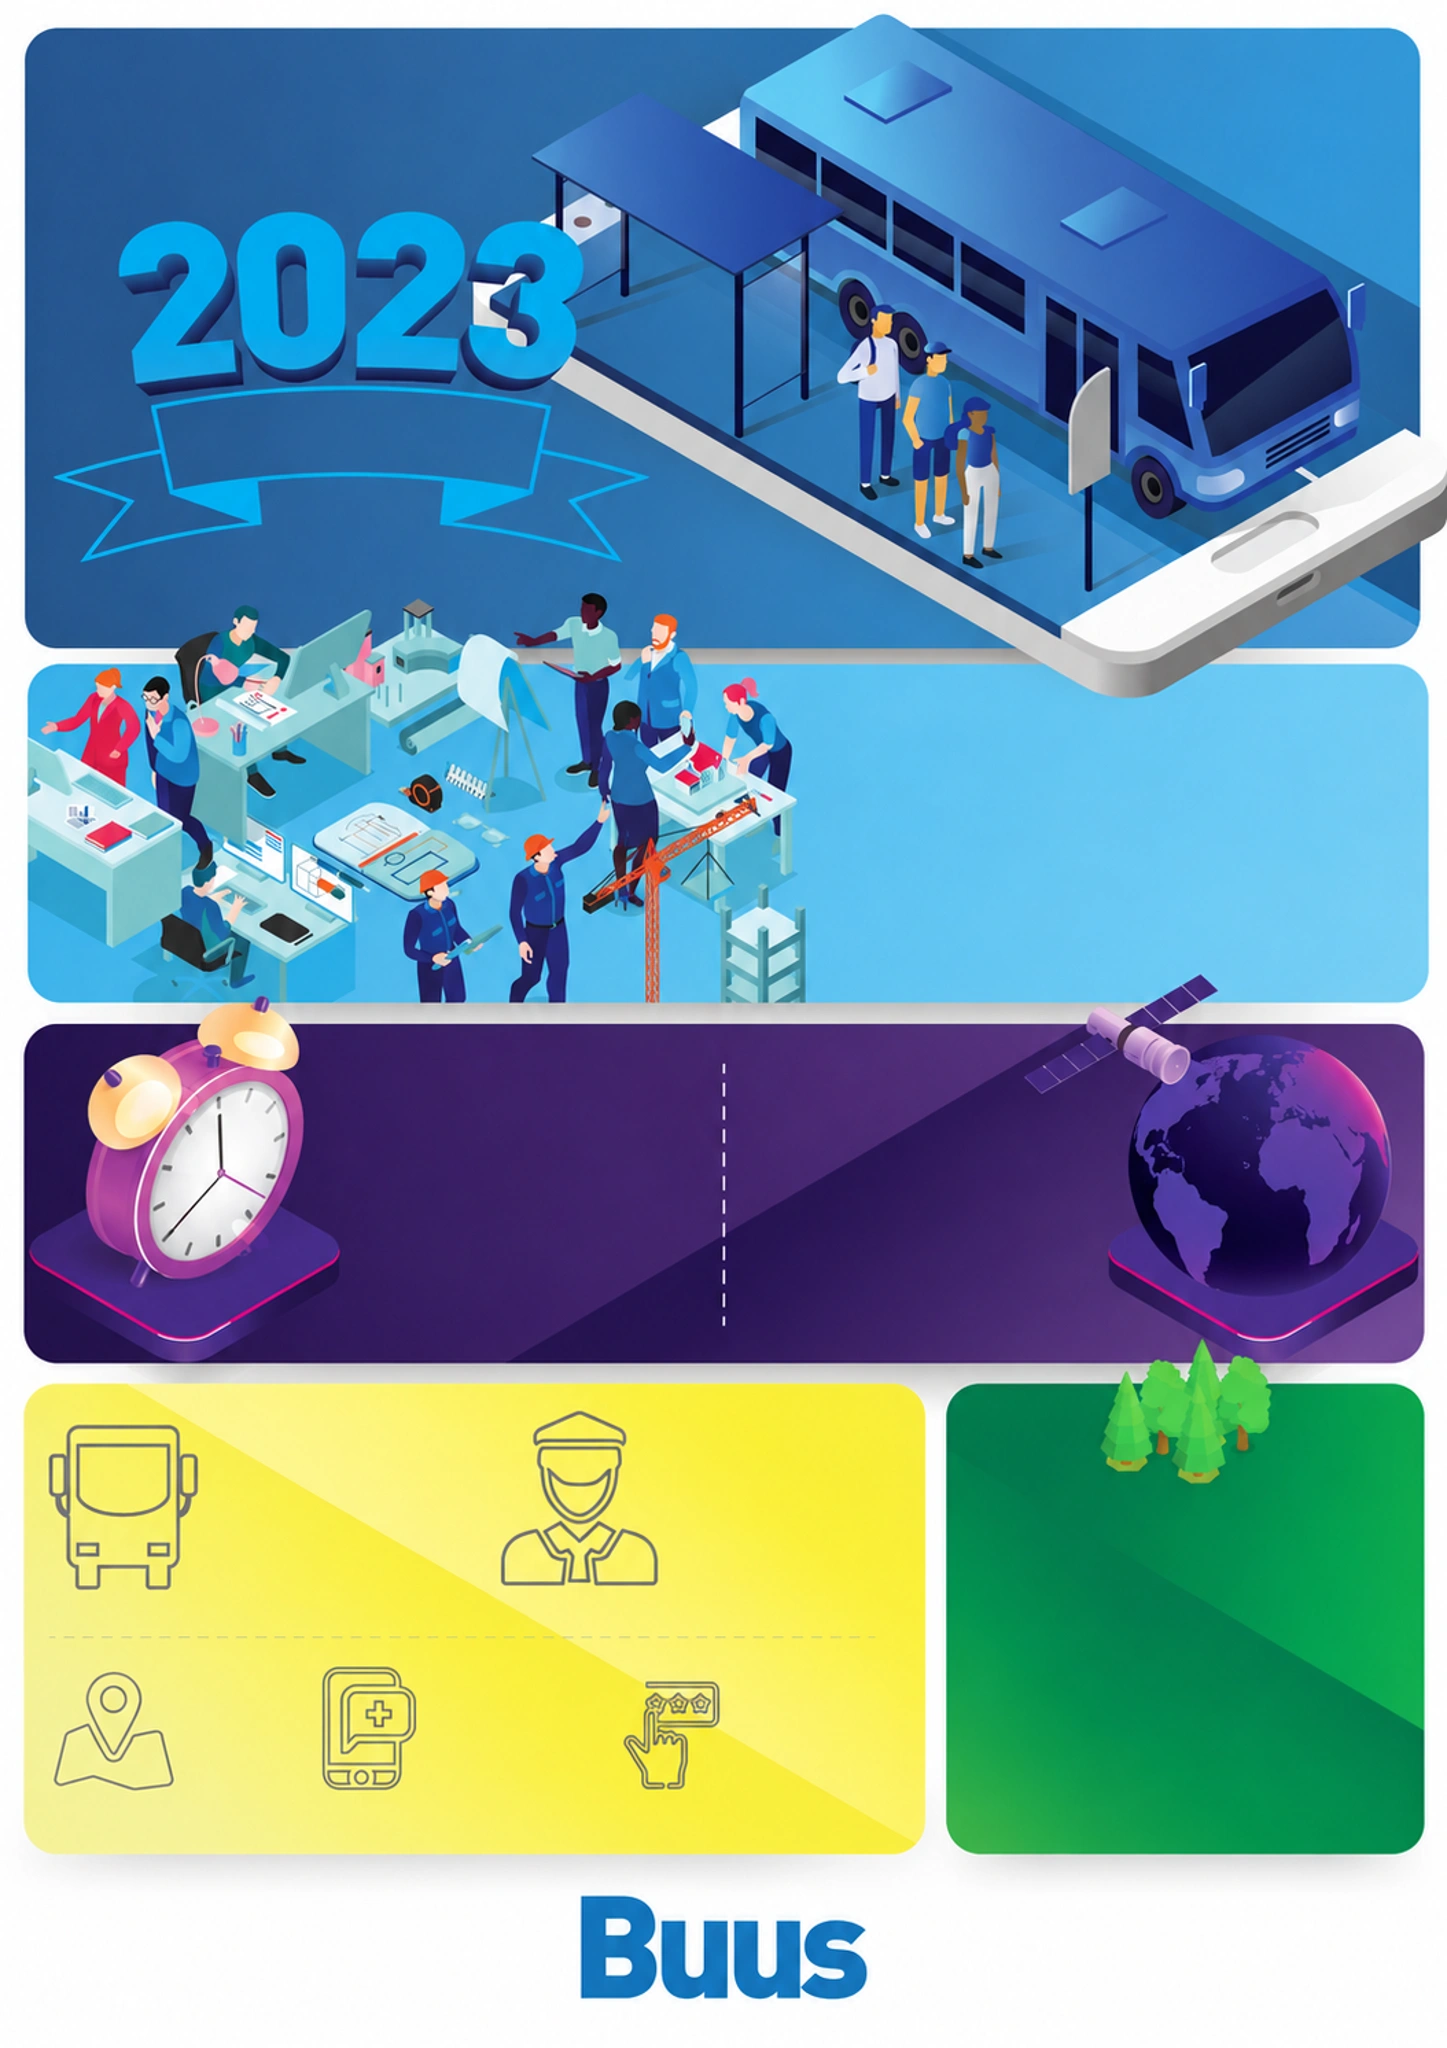
Original 2023 infographic artwork with mobility illustrationsMobility illustration from the 2023 report
in numbers
5.7 millionBoardings 18.8% vs 2022
456 thousandTrips completed 2.4% vs 2022
21 millionKilometres travelled 28.0% vs 2022
1,030Vehicles in operation 33.1% vs 2022
1,448Drivers trained 23.6% vs 2022
5,000Existing routes
1,000,000App logins
148,000Trip ratings
46 thousandTonnes of CO₂ avoided 76.9% vs 2022
1,850,000Equivalent trees 85.0% vs 2022
Buus presents
in numbers
Reduction in emissions

About these comparisons

▲ Green means a higher reported value; ▼ red means a lower reported value. Changes compare the same KPI with 2022. A missing arrow means the previous year is unavailable or did not report that KPI. Direction describes the number, not a judgment about performance.

Figures retain the precision of the source infographic. Percentages calculated from rounded figures are approximate. Boardings count journeys onto vehicles; passengers count people. These are kept separate.

View the figures and year-on-year changes
KPI2023vs 2022
Boardings5,700,000 18.8% vs 2022
Trips completed456,000 2.4% vs 2022
Kilometres travelled21,000,000 28.0% vs 2022
Vehicles in operation1,030 33.1% vs 2022
Drivers trained1,448 23.6% vs 2022
Existing routes5,000Not available
App logins1,000,000Not available
Trip ratings148,000Not available
Tonnes of CO₂ avoided46,000 76.9% vs 2022
Equivalent trees1,850,000 85.0% vs 2022