

← All Insights

2025 in numbers

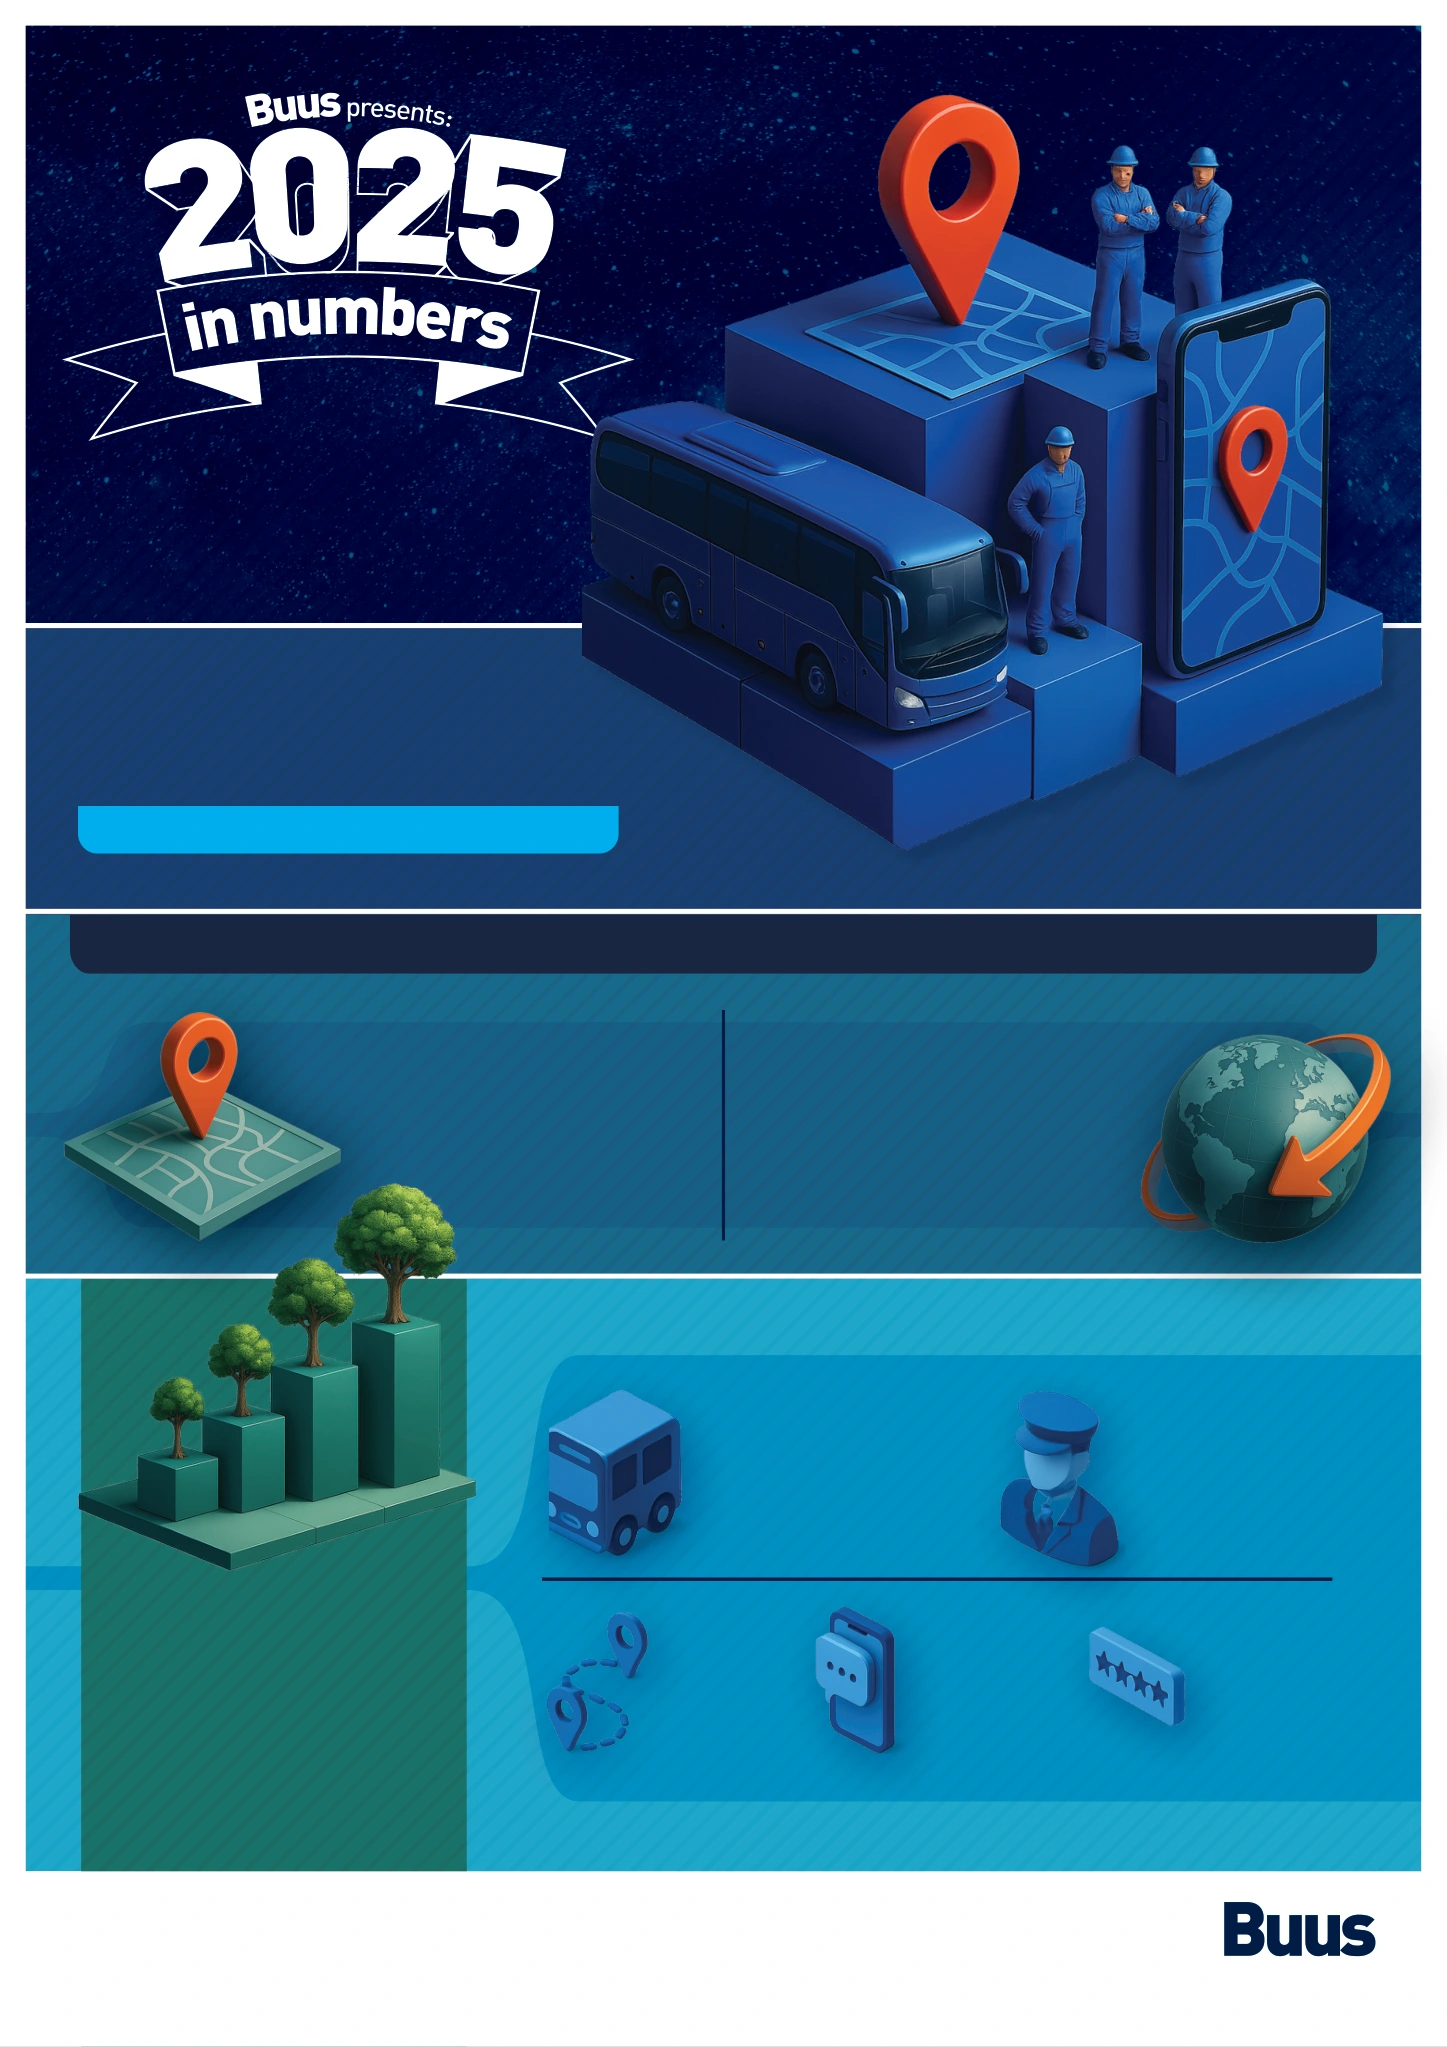
Original 2025 infographic artwork with mobility illustrationsMobility illustration from the 2025 report
Buus presents: 2025 in numbers
9,290,675Boardings 34.6% vs 2024
51,400Passengers served 33.5% vs 2024
664,672Trips completed 28.6% vs 2024
25,789,083Kilometres travelled 28.4% vs 2024
2,356Vehicles in operation 13.4% vs 2024
3,075Drivers trained 29.5% vs 2024
11,556Existing routes 74.6% vs 2024
3,414,466App logins 100.9% vs 2024
694,549Trip ratings 45.0% vs 2024
64,574Tonnes of CO₂ avoided 17.2% vs 2024
2,583,000Equivalent trees 16.7% vs 2024
BUUS
OVERVIEW
The paths take us further, but the people make us proud.
Reduction in emissions

About these comparisons

▲ Green means a higher reported value; ▼ red means a lower reported value. Changes compare the same KPI with 2024. A missing arrow means the previous year is unavailable or did not report that KPI. Direction describes the number, not a judgment about performance.

Figures retain the precision of the source infographic. Percentages calculated from rounded figures are approximate. Boardings count journeys onto vehicles; passengers count people. These are kept separate.

View the figures and year-on-year changes
KPI2025vs 2024
Boardings9,290,675 34.6% vs 2024
Trips completed664,672 28.6% vs 2024
Kilometres travelled25,789,083 28.4% vs 2024
Vehicles in operation2,356 13.4% vs 2024
Drivers trained3,075 29.5% vs 2024
Passengers served51,400 33.5% vs 2024
Existing routes11,556 74.6% vs 2024
App logins3,414,466 100.9% vs 2024
Trip ratings694,549 45.0% vs 2024
Tonnes of CO₂ avoided64,574 17.2% vs 2024
Equivalent trees2,583,000 16.7% vs 2024