
← All Insights

2022 in numbers

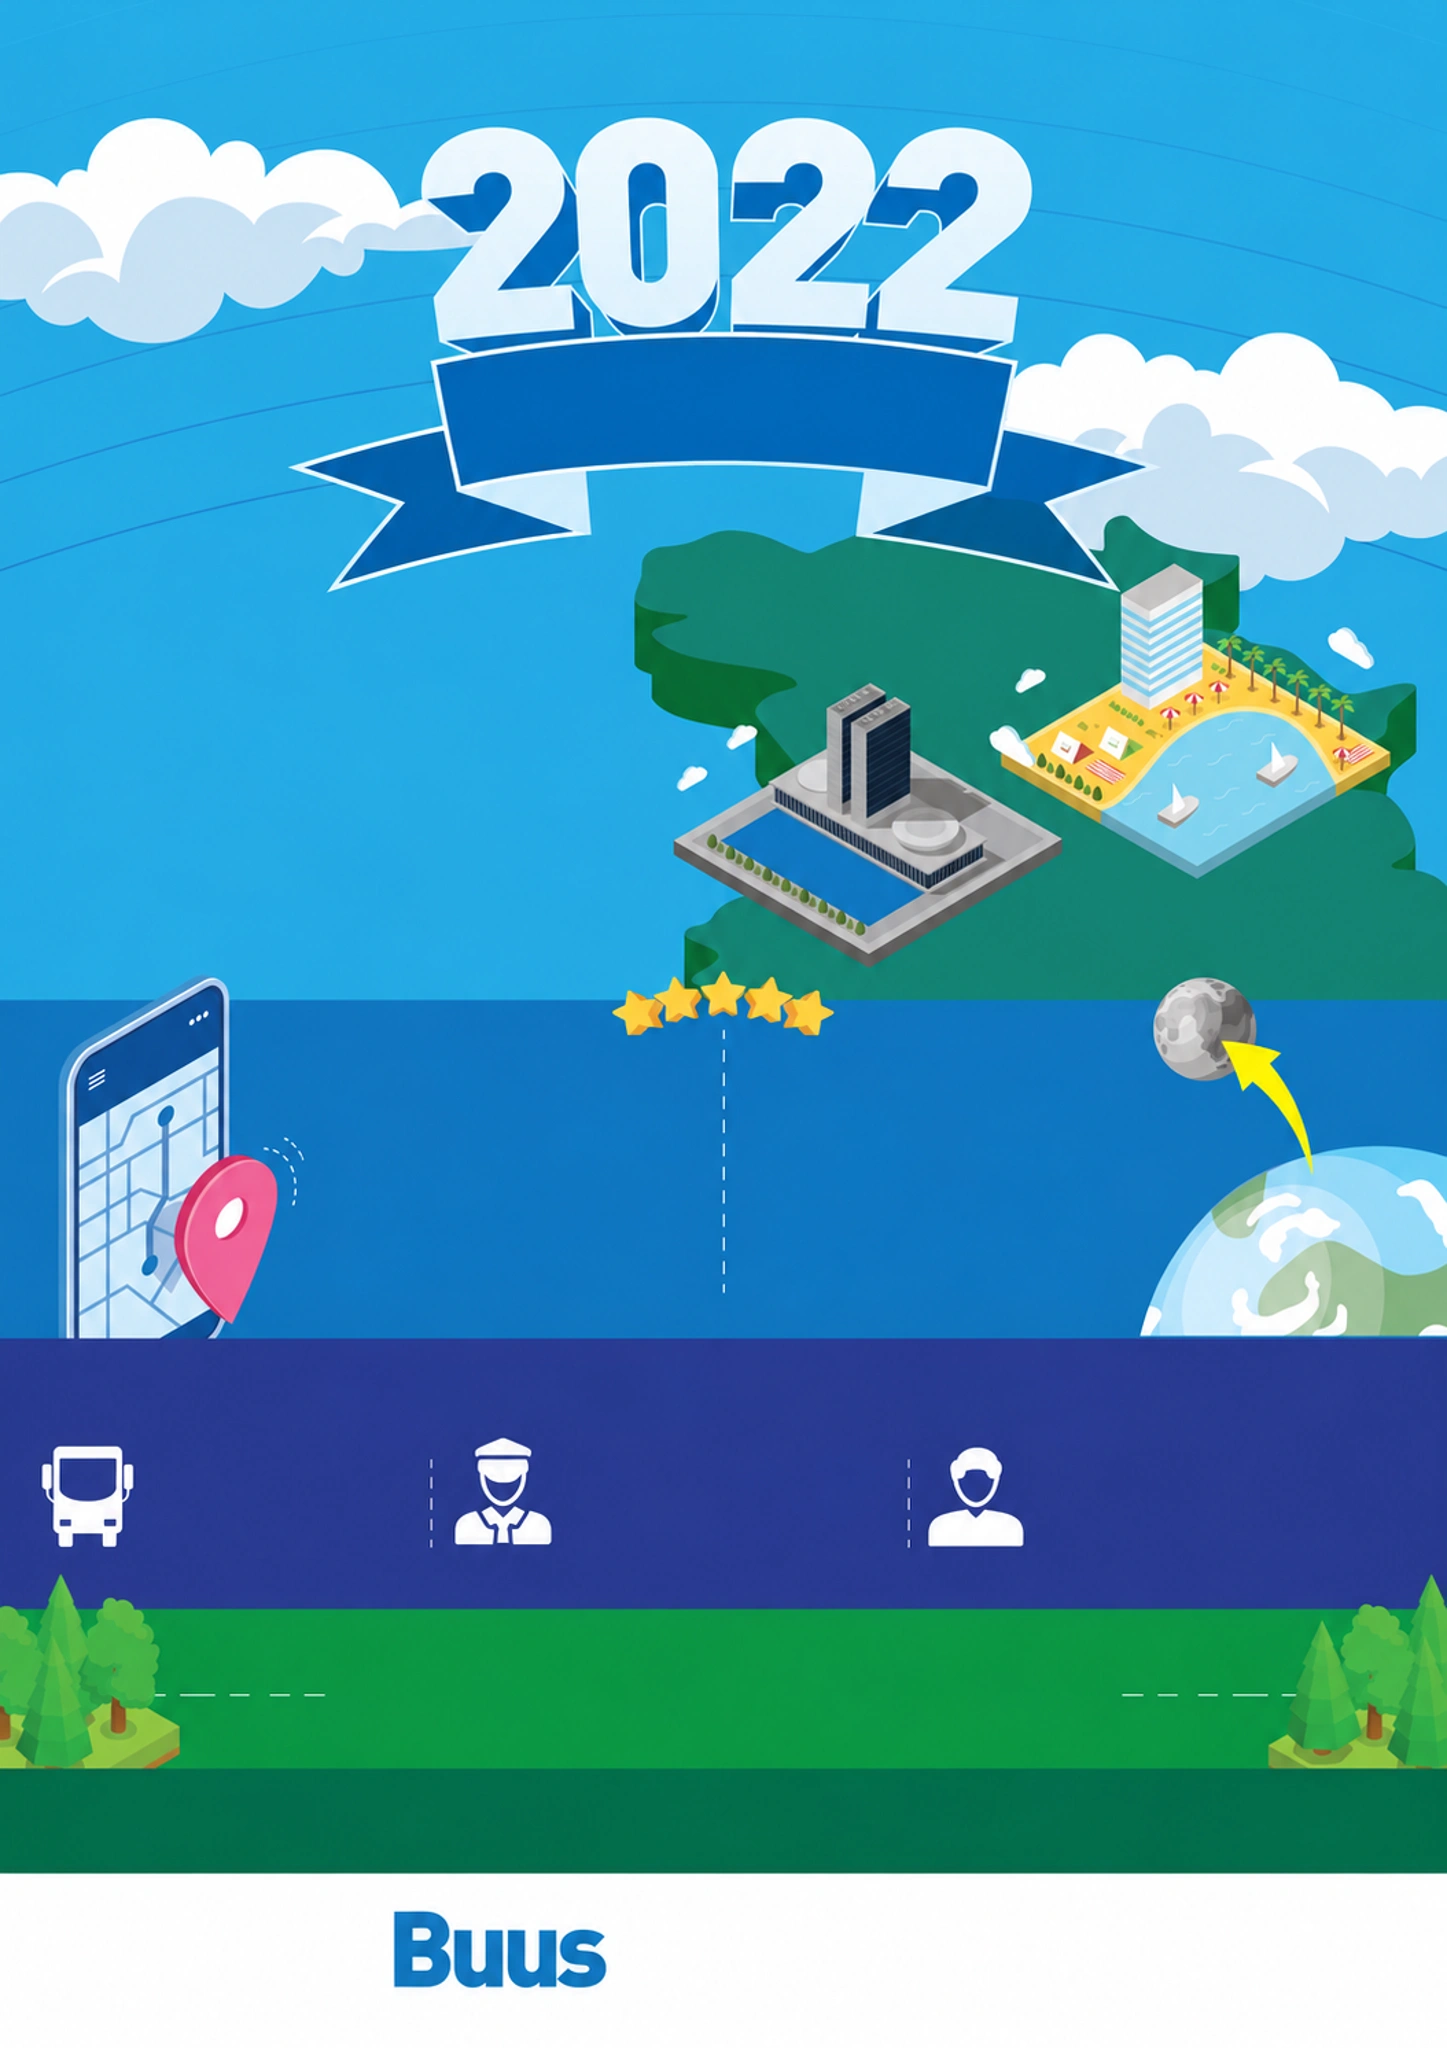
Original 2022 infographic artwork with mobility illustrationsMobility illustration from the 2022 report
in numbers
4.8 millionBoardings
467 thousandTrips completed
16.4 millionKilometres travelled
1,540Vehicles in operation
1,895Drivers trained
24,600Passengers served
26 thousandTonnes of CO₂ avoided
1 millionEquivalent trees
in numbers
Buus presents
We transported more people than the combined populations of Brasília and Recife.
Recife · 1.6 million residents
Brasília · 3.1 million residents
Imagine how much human energy was generated!
The same distance as 43 journeys to the Moon.
More numbers that make us proud
Our operation was incredible. Here’s to an even better 2023!

About these comparisons

▲ Green means a higher reported value; ▼ red means a lower reported value. Changes compare the same KPI with 2021. A missing arrow means the previous year is unavailable or did not report that KPI. Direction describes the number, not a judgment about performance.

Figures retain the precision of the source infographic. Percentages calculated from rounded figures are approximate. Boardings count journeys onto vehicles; passengers count people. These are kept separate.

View the figures and year-on-year changes
KPI2022vs 2021
Boardings4,800,000Not available
Trips completed467,000Not available
Kilometres travelled16,400,000Not available
Vehicles in operation1,540Not available
Drivers trained1,895Not available
Passengers served24,600Not available
Tonnes of CO₂ avoided26,000Not available
Equivalent trees1,000,000Not available